
A challenge in understanding the CAP ecosystem as a whole is assembling data that can be analysed across publishers. Until now, we have not organised the alerts collected by alert-hub.org in a way that readily supports this wider analysis.
The reporting tools bring collection evidence and alert content together. We can use them to investigate how alerts are processed, how hazards are described, and what patterns emerge across the emergency alerting problem space.
This article accompanies a presentation for the CAP training session at The CAP Workshop and training 2026. It introduces four capabilities in the CAP Aggregator that support this wider view: collection diagnostics, vocabulary evidence, keyword exploration and monthly reports. Individual feeds and messages provide concrete examples within that analysis. The dataset reflects the feeds and records available to alert-hub.org, so its coverage limits the conclusions we can draw about the ecosystem.
Training session resources: PowerPoint · PDF · speaker notes. The talk uses approximately 26 minutes, leaving four minutes for questions within a 30-minute slot.
The figures below were inspected on 5 October 2026. Operational figures change. The September monthly report was finalised on 3 October. Vocabulary statistics are a separate saved snapshot; keyword queries are live archive queries. Their totals need not agree.
1. Obtaining alerts: the source page
Ecosystem analysis depends on understanding which alerts reach the collection and where observations may be missing. The Mexico SMN source page illustrates that collection boundary for one contributing feed. It connects the upstream feed with operational evidence and reports about the records obtained from it.
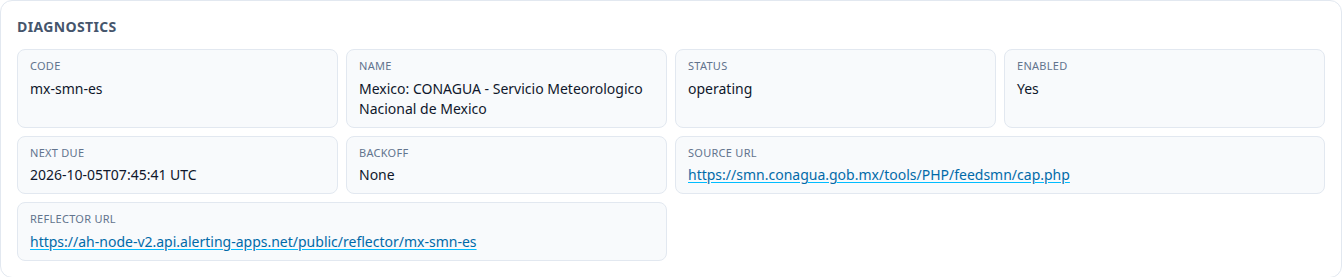
The source page identifies the feed being collected. Cropped interface captures use deployed frontend assets and live API responses; capture details are recorded below.
The feed URL is the starting point for discovery. The collector checks the feed, discovers referenced alert documents, retrieves them and processes their contents for downstream use and archive analysis. The source page lets us inspect that boundary. Its scheduling and backoff fields help explain when another attempt is due or whether failures have slowed collection. A reflector URL provides a separate route to the reflected collection.
A successful feed check is only one step. It does not establish that every referenced document was available, that the publisher’s feed contains its complete publication history, or that every field in an alert is useful to every consumer. The reporting sections provide additional evidence.
Guidance Signals

The pills connect observed characteristics with numbered implementation guidance. Hovering provides the reason for the signal and the evidence behind it. In this capture, the unknown-value signal identifies 65 UNKNOWN-SEVERITY tag matches and 172 UNKNOWN-CERTAINTY tag matches in the source reporting window. The visible badge shows 237 because the implementation adds those evidence counts. It does not establish 237 distinct affected alerts; the sets can overlap.
The actual hover text also explains that these values can cause consumer interoperability problems. The saved hover text preserves the complete wording from the pill’s title attribute. Browser-native title tooltips did not appear in the headless image capture, so the deck places the extracted wording beside the genuine pill screenshot.
The signals point to the advisory document Advice on Implementing a CAP-enabled Alerting System, which is labelled a July 2016 draft. They are prompts for investigation, not a substitute for CAP schema validation or the requirements of a particular national profile. A publisher may have a legitimate reason for a flagged choice. Consumer behaviour and local policy should inform the discussion.
The other visible signals concern event text length and geocodes without polygons. Together they make the source page a practical way to connect aggregate counts with concrete questions for a feed owner. They should not become a ranking of publishers.
Latest Errors and Health Buckets
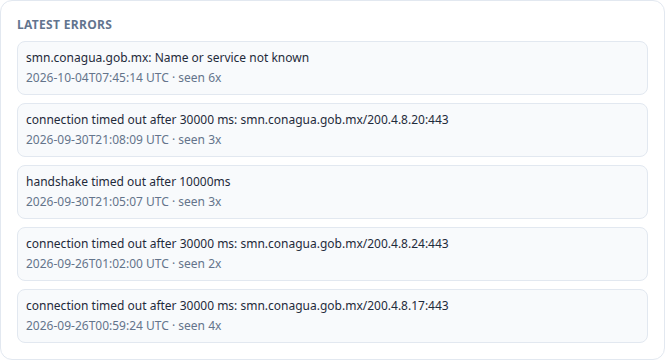
Recent error summaries retain their timestamps and repetition counts.
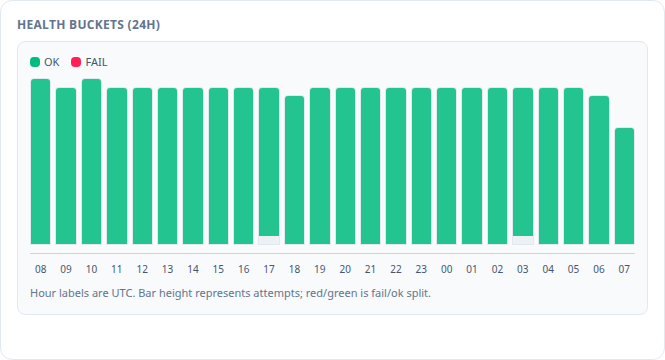
Bar height represents collection attempts; green and red distinguish successful and failed attempts.
These sections answer related questions at different time scales. Latest Errors identifies what failed and when. The captured examples include DNS resolution and timeout failures. Health Buckets shows the distribution of attempts during the most recent 24 hours. Read the timestamps before treating an error summary as a current outage.
The API evidence collected for this draft showed 468 successful attempts and zero failures in that 24-hour health summary, while an older DNS error remained visible. The exact rolling total can change between captures. This is a useful teaching example: an old error and healthy recent collection can coexist.
Collection attempts are not publication volume. Repeatedly obtaining an unchanged feed can produce many successful checks and few new alerts. Conversely, a collection problem can create a gap in our observations without proving that the publisher issued no warnings.
Longer operational context
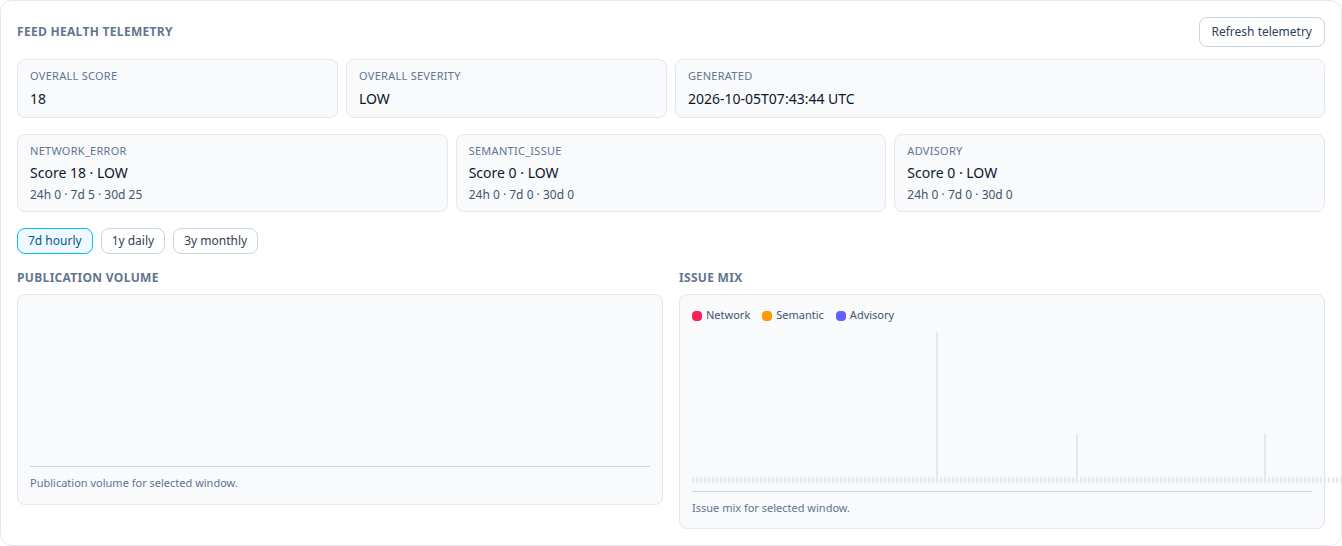
Feed Health Telemetry is a useful additional screen for the talk. It separates network errors from semantic issues and advisories, and offers longer time windows. The point is to investigate timing and type of difficulty rather than reduce a feed to a single score.
The nearby Feed Reporting section shows monthly volume and field-derived categories. Its current month is live and partial; its historic comparison spans completed months. This is another reason to name the period before comparing counts. Source history and alert inspection provide follow-up routes when a summary raises a question.
2. Vocabulary use: evidence for term development
Shared vocabularies give us a way to describe hazards across the ecosystem. The OET vocabulary report, version ID 2 lets us examine how a maintained term list relates to the alerts in the collection, including where usage is concentrated and where evidence is missing.
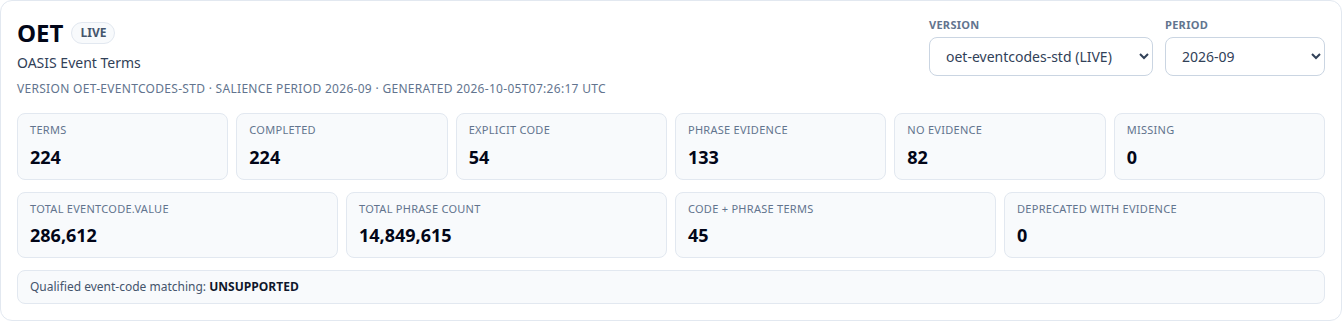
The selected vocabulary has 224 terms. Version ID 2 is the console’s identifier; its version label is oet-eventcodes-std.
The selected salience period is 2026-09, but that label requires care. Inspection of the implementation confirms that it selects a saved snapshot. The term-count queries in this implementation are not filtered to that calendar month. These are archive-wide counts as recorded when the snapshot was generated, not September-only usage. The term rows’ first/last periods also extend outside September.
All 224 terms completed successfully in this snapshot; none were missing or failed. The summary reports:
| Evidence | Terms | Share of 224 terms |
|---|---|---|
Explicit eventCode.value evidence | 54 | 24.1% |
| Preferred-label phrase evidence | 133 | 59.4% |
| Both code and phrase evidence | 45 | 20.1% |
| Neither kind of evidence | 82 | 36.6% |
These categories overlap: the 45 terms with both kinds of evidence appear in the first two rows. There are 142 terms with either kind of evidence. A missing or failed computation would require a different interpretation from a completed computation with no matches.
Phrase evidence is not vocabulary adoption. A publisher can write “air quality” without using an OET code. A phrase may also appear in background explanation rather than identify the warning’s principal subject. Conversely, a publisher may use another language, a synonym or a local event vocabulary that this preferred-label phrase query does not capture.
The report also says qualified event-code matching is unsupported. The code counts demonstrate matches on eventCode.value; they do not establish a matching code/valueName pair under an identified vocabulary scheme. This limitation matters when discussing formal adoption.
Concentration matters as well as coverage
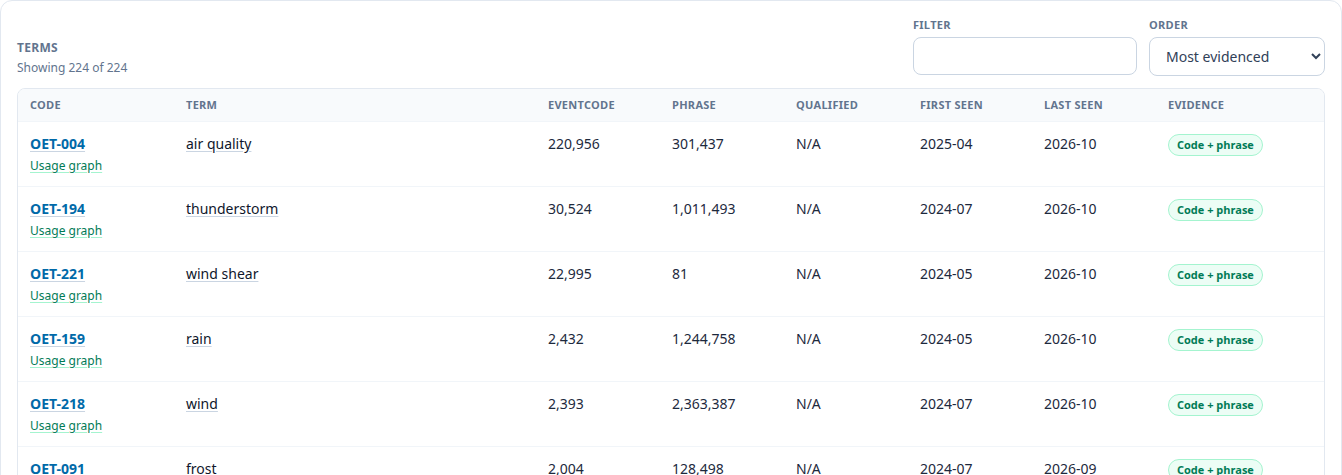
The strongest rows show a concentrated pattern:
| Code | Preferred label | Explicit code matches |
|---|---|---|
| OET-004 | air quality | 220,956 |
| OET-194 | thunderstorm | 30,524 |
| OET-221 | wind shear | 22,995 |
OET-004 accounts for 77.1% of the sum of all per-term code counts in the snapshot: 220,956 out of 286,612. The first three terms together account for 95.8% of that sum. This is a measure of concentration across term counts, not a percentage of distinct alerts or publishers. An alert can carry more than one code.
There is also an informative contrast between code and phrase evidence. “Wind” has over 2.36 million phrase matches but 2,393 code matches. “Wind shear” has 22,995 code matches but only 81 preferred-label phrase matches. The figures illustrate different publishing conventions; they do not by themselves explain those conventions.
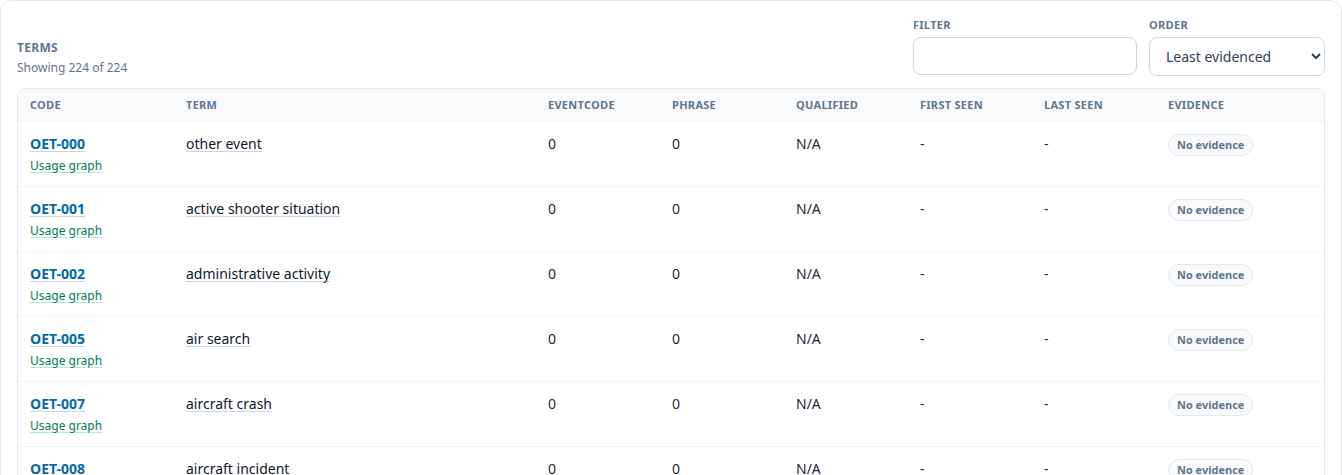
The least-evidenced view is useful for review, but absence from this collection is not proof that a term has no purpose. Rare hazards may need representation even when no examples occur in the observed archive. Coverage, language, publication cadence and exact matching all affect the result.
The question for vocabulary development is: How can term development be informed by observed publishing practice? Evidence can help identify common needs, troublesome distinctions, missing synonyms and opportunities to document how publishers should choose a term. Frequency should inform that work alongside expert knowledge and coverage of uncommon hazards.
A usage graph and its contributing sender
The OET-004 row links to the keyword explorer usage graph.
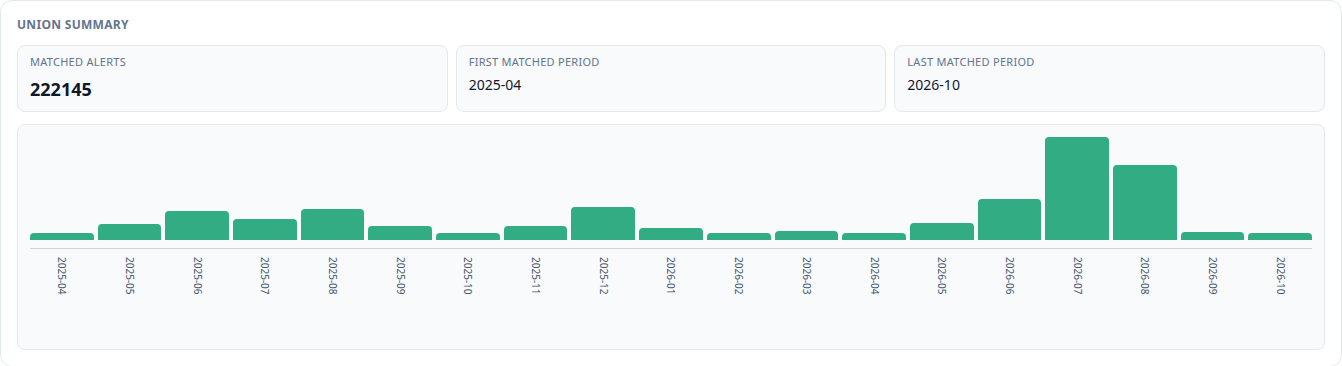
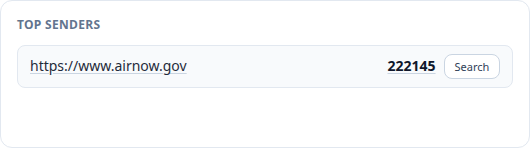
In the live all-field query, 222,145 matched alerts were attributed to one sender value, https://www.airnow.gov. That is a result within this query, not proof that only one organisation uses OET worldwide. It does show why a large message count should not be read as evidence of widespread publisher adoption.
The live explorer count differs from the saved vocabulary count of 220,956. The explorer searches the selected fields, while the vocabulary’s explicit-code metric searches the code field; the snapshot and live query also have different observation times. A fair comparison would hold the fields and observation time constant.
3. Keyword explorer: related language in context
An ecosystem view also needs to account for differences in the language publishers use. The hurricane, cyclone, typhoon and “tropical storm” query shows how we can investigate related expressions across the collection. Enter individual tokens and quote phrases; select the CAP fields to search and, when appropriate, restrict the date range.
These words have related uses, but they are not interchangeable in every meteorological or regional context. The explorer lets us investigate how publishers use them; it does not automatically impose a concept mapping.

For this comparison, both date controls are set to September 2026.
The unrestricted example returned 76,362 matches and included a last matched period of 2568-07. Alternate calendars used by publishers are an active data-quality concern in this dataset. This bucket is an example to investigate against the original publisher date and calendar convention; this draft does not establish the cause for each contributing record. A future-looking bucket should not be narrated as a forecast. Calendar normalization needs to preserve the original evidence and distinguish genuine future timing from a calendar interpretation problem.
The bounded September query gives us a more controlled comparison of language within one named period. The date filter is applied by the API, not by downloading archive history and filtering it locally.
Union totals and overlapping matches
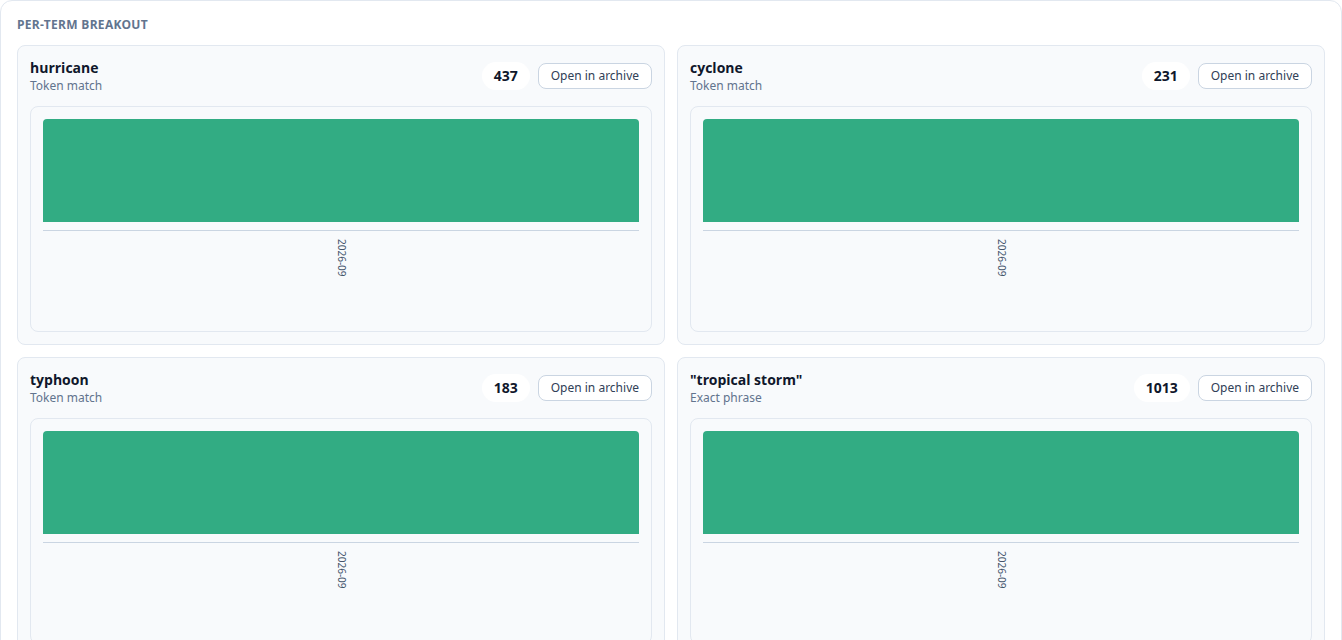
| Query term | September matched alerts |
|---|---|
| hurricane | 437 |
| cyclone | 231 |
| typhoon | 183 |
| “tropical storm” | 1,013 |
| Unique union across the four terms | 1,353 |
The four term counts sum to 1,864, exceeding the unique union by 511. This proves overlap, but it does not tell us that 511 distinct alerts contain multiple terms: one alert can contribute to more than two term counts. Use the union when counting the records matching any of the terms.
A chart shows when matches occur. The per-term breakout shows which expressions contribute. A shift in wording, a shift in contributing publishers, and a change in collection coverage can all change those plots. None is automatically a change in hazard incidence.
Fields change the meaning of a match
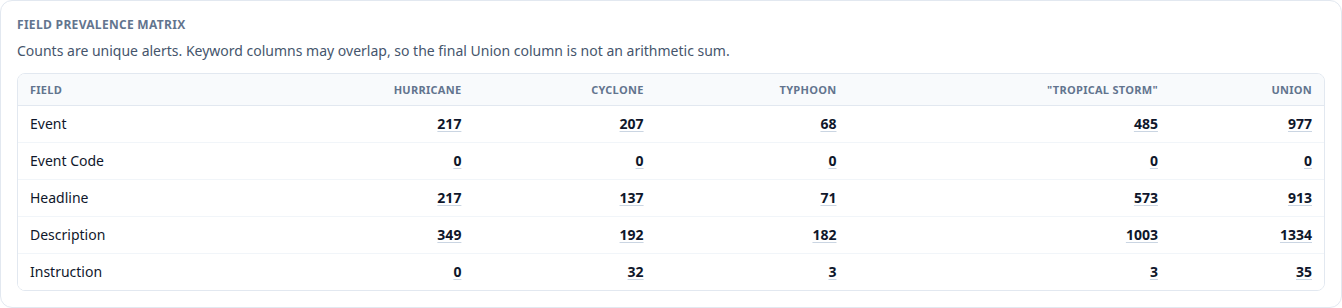
The field matrix shows where the language appears. In this bounded query, 1,334 of the 1,353 matching alerts contain at least one searched term in Description, compared with 977 in Event, 913 in Headline and 35 in Instruction. These field counts overlap.
Description therefore reaches more records than Event for this query. It may also contain contextual mentions. An Event-only query is useful for a narrower question about the warning’s stated event; a broader query is useful for investigating the language of the message. Neither is intrinsically the right choice for every analysis.
The zero matches in Event Code mean these particular words were not found there under this query. They do not mean the alerts lack event codes: the codes may be identifiers rather than English hazard words.
Sender context and inspection
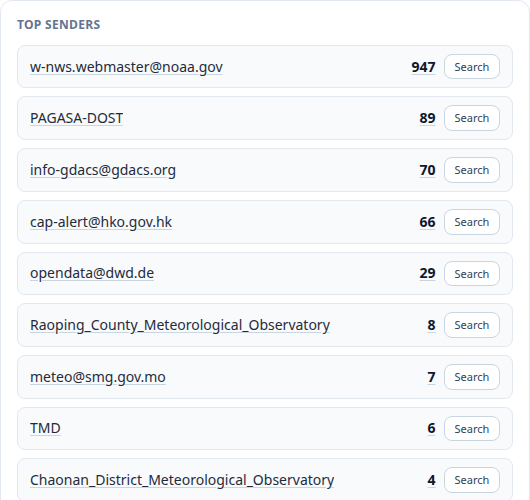
The largest sender value contributes 947 of 1,353 matching alerts, or 70.0% of the union. The visible result is therefore strongly influenced by one sender’s publication practice. Sender breakdowns help distinguish vocabulary breadth from a high-volume contribution.
The sender-period matrix supplies a route to investigate changes over time. Tag prevalence and sender-tag matrices add diagnostic context, and sample alerts help check whether the query matches the intended concept. Linked matrix cells and archive links make it possible to inspect the records behind a count. Samples are bounded examples, not a representative statistical sample.
For comparisons across publishers, hold the period and selected fields constant, inspect several messages, and account for language. English terms do not exhaust the words used to describe these hazards. Differences in national mandates, feed structure, updates and repeated warnings can also affect volume.
4. Monthly reports: a shared dataset view
To investigate change across the ecosystem, we need a common period reference that includes the contributions of different feeds. The September 2026 monthly report provides that view of the observed collection, with downloadable Markdown and JSON for subsequent analysis.
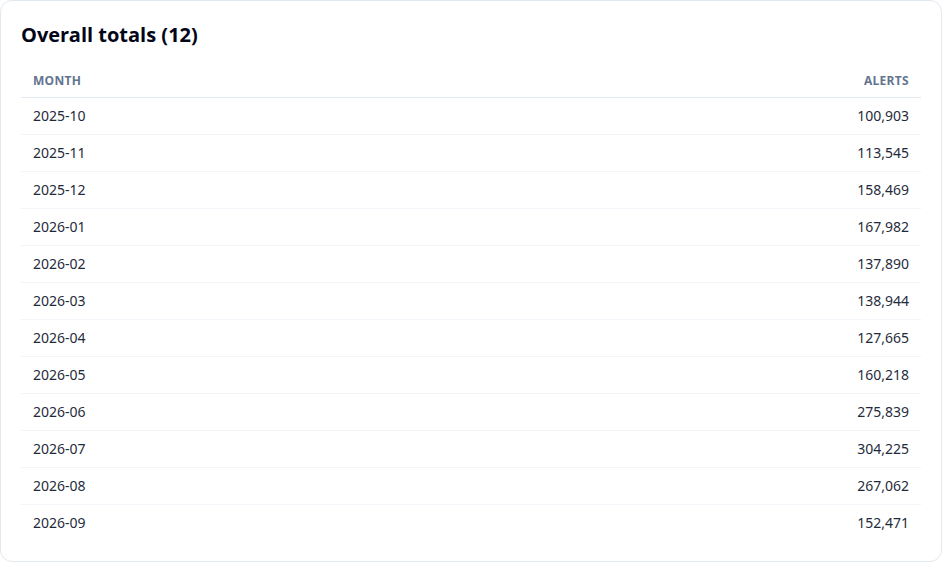
The report covers October 2025 through September 2026. It lists 189 sources, of which 152 have non-zero September contributions. Its September total is 152,471, compared with 267,062 in August: a decrease of 42.9% in the recorded monthly total.
This is a change in the observed dataset. It is not evidence that the world experienced 42.9% fewer hazards. One feed, us-epa-aq-en, falls from 45,356 to 3,885 records and accounts arithmetically for 36.8% of the net decrease. That identifies a useful investigation target; it does not establish whether the cause was publication practice, collection, processing, or the underlying conditions. The archive’s OET-004 graph offers related context, but its count is not the same measure as this source’s monthly-report total.
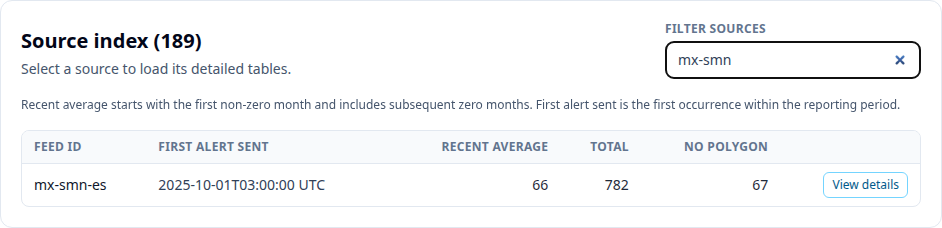
The source index connects the overall report with individual feeds. Its Total, No polygon and recent average concern the report’s rolling window; do not assume every column is September-only. For Mexico SMN, the full-window total is 782, while its month histogram records 154 in September.
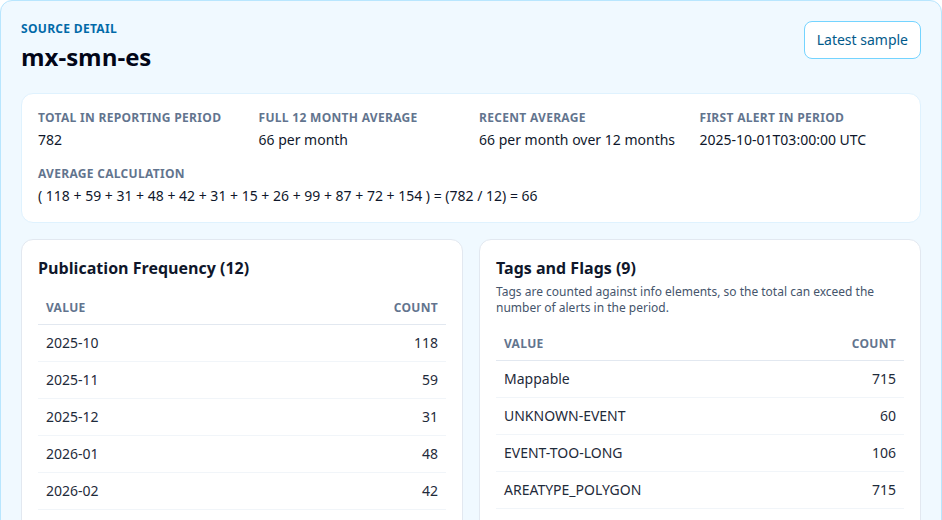
The detail view explains the averages and breaks down publication frequency and field-derived categories. A full 12-month average includes the whole window. The recent average starts at the first non-zero month and includes later zero months. That distinction is particularly useful for newly observed feeds.
Tags are counted against information elements, so their totals may exceed the number of alerts. Multilingual messages and overlapping categories require similar care. Message counts also include publishing behaviour such as updates; they are not automatically unique incidents.
A finalised report identifies its period and creation time. Retaining a downloaded copy makes a particular comparison reproducible; do not assume a report can never be regenerated. JSON supports further aggregate analysis without requiring database access or a complete local archive.
A method for ecosystem analysis
The four capabilities work together. Source pages help establish the collection context. Vocabulary reports compare maintained terms with archive evidence. Keyword exploration tests how wording and codes appear across fields and senders. Monthly reports give those investigations a shared period reference.
A useful working method is to state the question, name the period and fields, inspect the distribution, and follow a surprising result back to examples. Record whether the evidence is operational, a saved snapshot, or a live query. Keep the counting unit visible.
For vocabulary discussion, the proposed next step is a review with publishers and vocabulary maintainers: which common publishing needs are well represented, where are mappings or synonyms missing, and which distinctions need clearer guidance? Rare hazards still need consideration. The value of the dataset is that these questions can be informed by actual messages rather than vocabulary design alone.
Other screens worth considering
For this first 30-minute pass, Feed Health Telemetry, field prevalence and sender breakdowns are included because each resolves a specific interpretation question. Possible follow-up additions are the source history view, the general Reporting page’s feed/sender comparison, sender-period and tag matrices, and a brief archive drill-down from a matrix cell. Each should replace another example if added to the talk, so the audience has time to read the screen.
The aim is to use this collection to gain insight across the CAP ecosystem: identify patterns shared across feeds, understand differences in publishing practice, and find gaps in the evidence. The workflow connects those wider questions to the messages and collection conditions behind each result.
Capture and evidence notes
The ordinary console routes returned HTTP 404 from the capture environment on 5 October. The deployed shell and microfrontend assets remained accessible. Screenshots render those deployed assets against the live API, with the existing production API configuration supplied to a temporary capture context. No counts or screen content were substituted. The normal console route, an actual logged-in browser screenshot, and its browser chrome are not being represented as successfully captured.
The supplied bearer token was used only for authorised reads and was not placed in publication assets. Captures omit the shell header and account controls. No operational actions, report generation or feed changes were performed. Hover wording was read from the live pill’s title attribute.
The source register and calculation notes record endpoint scope, observation dates, implementation references and arithmetic. The package retains selected aggregate evidence, not broad archive records or credentials.
Download the PowerPoint, PDF, or rehearsal script.
For discussion: Ian Ibbotson, CTO, Alert-Hub.org, or the Telegram CAP community.